k8s-provision-tui: the DR automation I didn't know I was building
I already run my Kubernetes clusters in a blue/green pattern: new color up, data migrated, old color torn down, every piece of it reproducible from git. The data-integrity problem was solved. What I hadn’t solved was the ceremony of actually doing the switch.
The procedure I kept postponing
Roughly, a blue/green cutover in my homelab looks like this:
- Verify fresh backups on the live color (VolSync, CNPG, Velero, K10).
- Prep the target color: wipe its per-color backup buckets and Ceph pool, deploy the Spectro cluster profile.
- Provision target VMs (Terraform + Proxmox), install the Palette agent (Ansible), and let Palette build the new cluster. Flux reconciles on the new color and workloads rehydrate from the fresh backups.
- Drain the live color: suspend Flux, hibernate non-critical CNPG clusters, scale down workloads, drain the nodes.
- Flip DNS (public + private) to the target color.
- Tear down the old color’s VMs.
The cutover lived in a wiki page. It was long. Really long. Dozens of steps, each one a shell command or a kubectl pipeline or a click in the Spectro Palette UI, with prerequisites that mattered, ordering that mattered, and invariants (“the live color must not be the target color”, “CNPG hibernation must happen after Flux is suspended”) that were easy to forget at step 17 when you’re tired.
Every step was documented. Every step was correct. It just took hours, demanded the kind of attention where one misstep would blow away live backups, and ate a full afternoon every time. So the procedure worked the way long procedures always work: I read it, dreaded it, and postponed whatever triggered the need to run it. The longer I postponed, the more drift accumulated in the old cluster, the scarier the switch felt, the longer I postponed. You know the loop.
From a bash script to a TUI
It started, as these things do, with a bash script. I wrapped the worst offenders first: tofu apply with the right TF_COLOR, an Ansible playbook runner, a backup-freshness check. Then a menu with gum so I didn’t have to remember flags. Then a second menu. Then state I needed to thread between menus and couldn’t, because it was bash.
Every attempt to pass structured data (a list of VMs, a status map, the outcome of a dry-run) between menus turned into another round of eval gymnastics or temp files. I rewrote it in Python using Textual and the difference was immediate.
A few weekends later I had a TUI with a live status dashboard, an accordion menu driving every phase of the procedure, and type-to-confirm guards on the destructive actions. The wiki page still exists; it’s now the specification the TUI implements, not something I follow by hand. Everything between the confirmations (listing VMs, polling the Palette API through rate limits, waiting for DNS to propagate) is done by the TUI, visibly, with a live status trail.
Reinstalling a cluster now fits in a Saturday afternoon. I don’t dread it; watching the dashboard light up green row by row is genuinely satisfying.
The realization
Somewhere around the fourth or fifth iteration, I noticed something odd. The TUI wasn’t really about reinstalls. Everything it did (bucket wipes, DNS flips with rollback, liveness guards against wiping the wrong cluster) was disaster recovery.
A planned blue/green reinstall is a controlled DR drill. The cluster is deliberately lost. The workloads are deliberately restored. The only difference between “I reinstalled green” and “green burned down in a fire” is whether the old cluster is still running during the restore. Same actions automated. Same safety invariants. Same backup dependencies.
I was building a DR automation tool and calling it a reinstall helper.
That reframe changed how I think about the TUI. Every feature I’d added to make the cutover safer (liveness checks, type-to-confirm for irreversible steps, backup-age gates) wasn’t just ergonomics. It was disaster recovery tooling. Using the TUI regularly for planned reinstalls, I’m continuously testing my actual DR path. The procedure I used in anger had already been rehearsed dozens of times.
What I deliberately kept, through every iteration, was the operator’s judgment. The TUI doesn’t run the whole procedure unattended: every destructive step still confirms, every mutation still shows the plan before it fires. That’s not a limitation, it’s the point. A DR tool that runs itself end-to-end is exactly the kind of tool that finds new ways to fail during the incident you built it for.
And that reframe matters beyond my homelab.
The runbook problem
A written runbook (a Confluence page, a wiki, a RUNBOOK.md) is a static description of a moving system. You read it top to bottom, you copy-paste the commands, and somewhere around step 14 you skip a line, or you paste a command with the wrong argument, or the step you’re on assumes a precondition that silently isn’t true anymore. That’s how incidents happen during planned work.
A TUI with a live status dashboard flips that: the current state is always in front of you, the next safe action is the one you can see lit up, and the tool refuses to fire a step whose precondition isn’t met. The runbook stops describing the system and becomes part of it.
What the TUI actually does
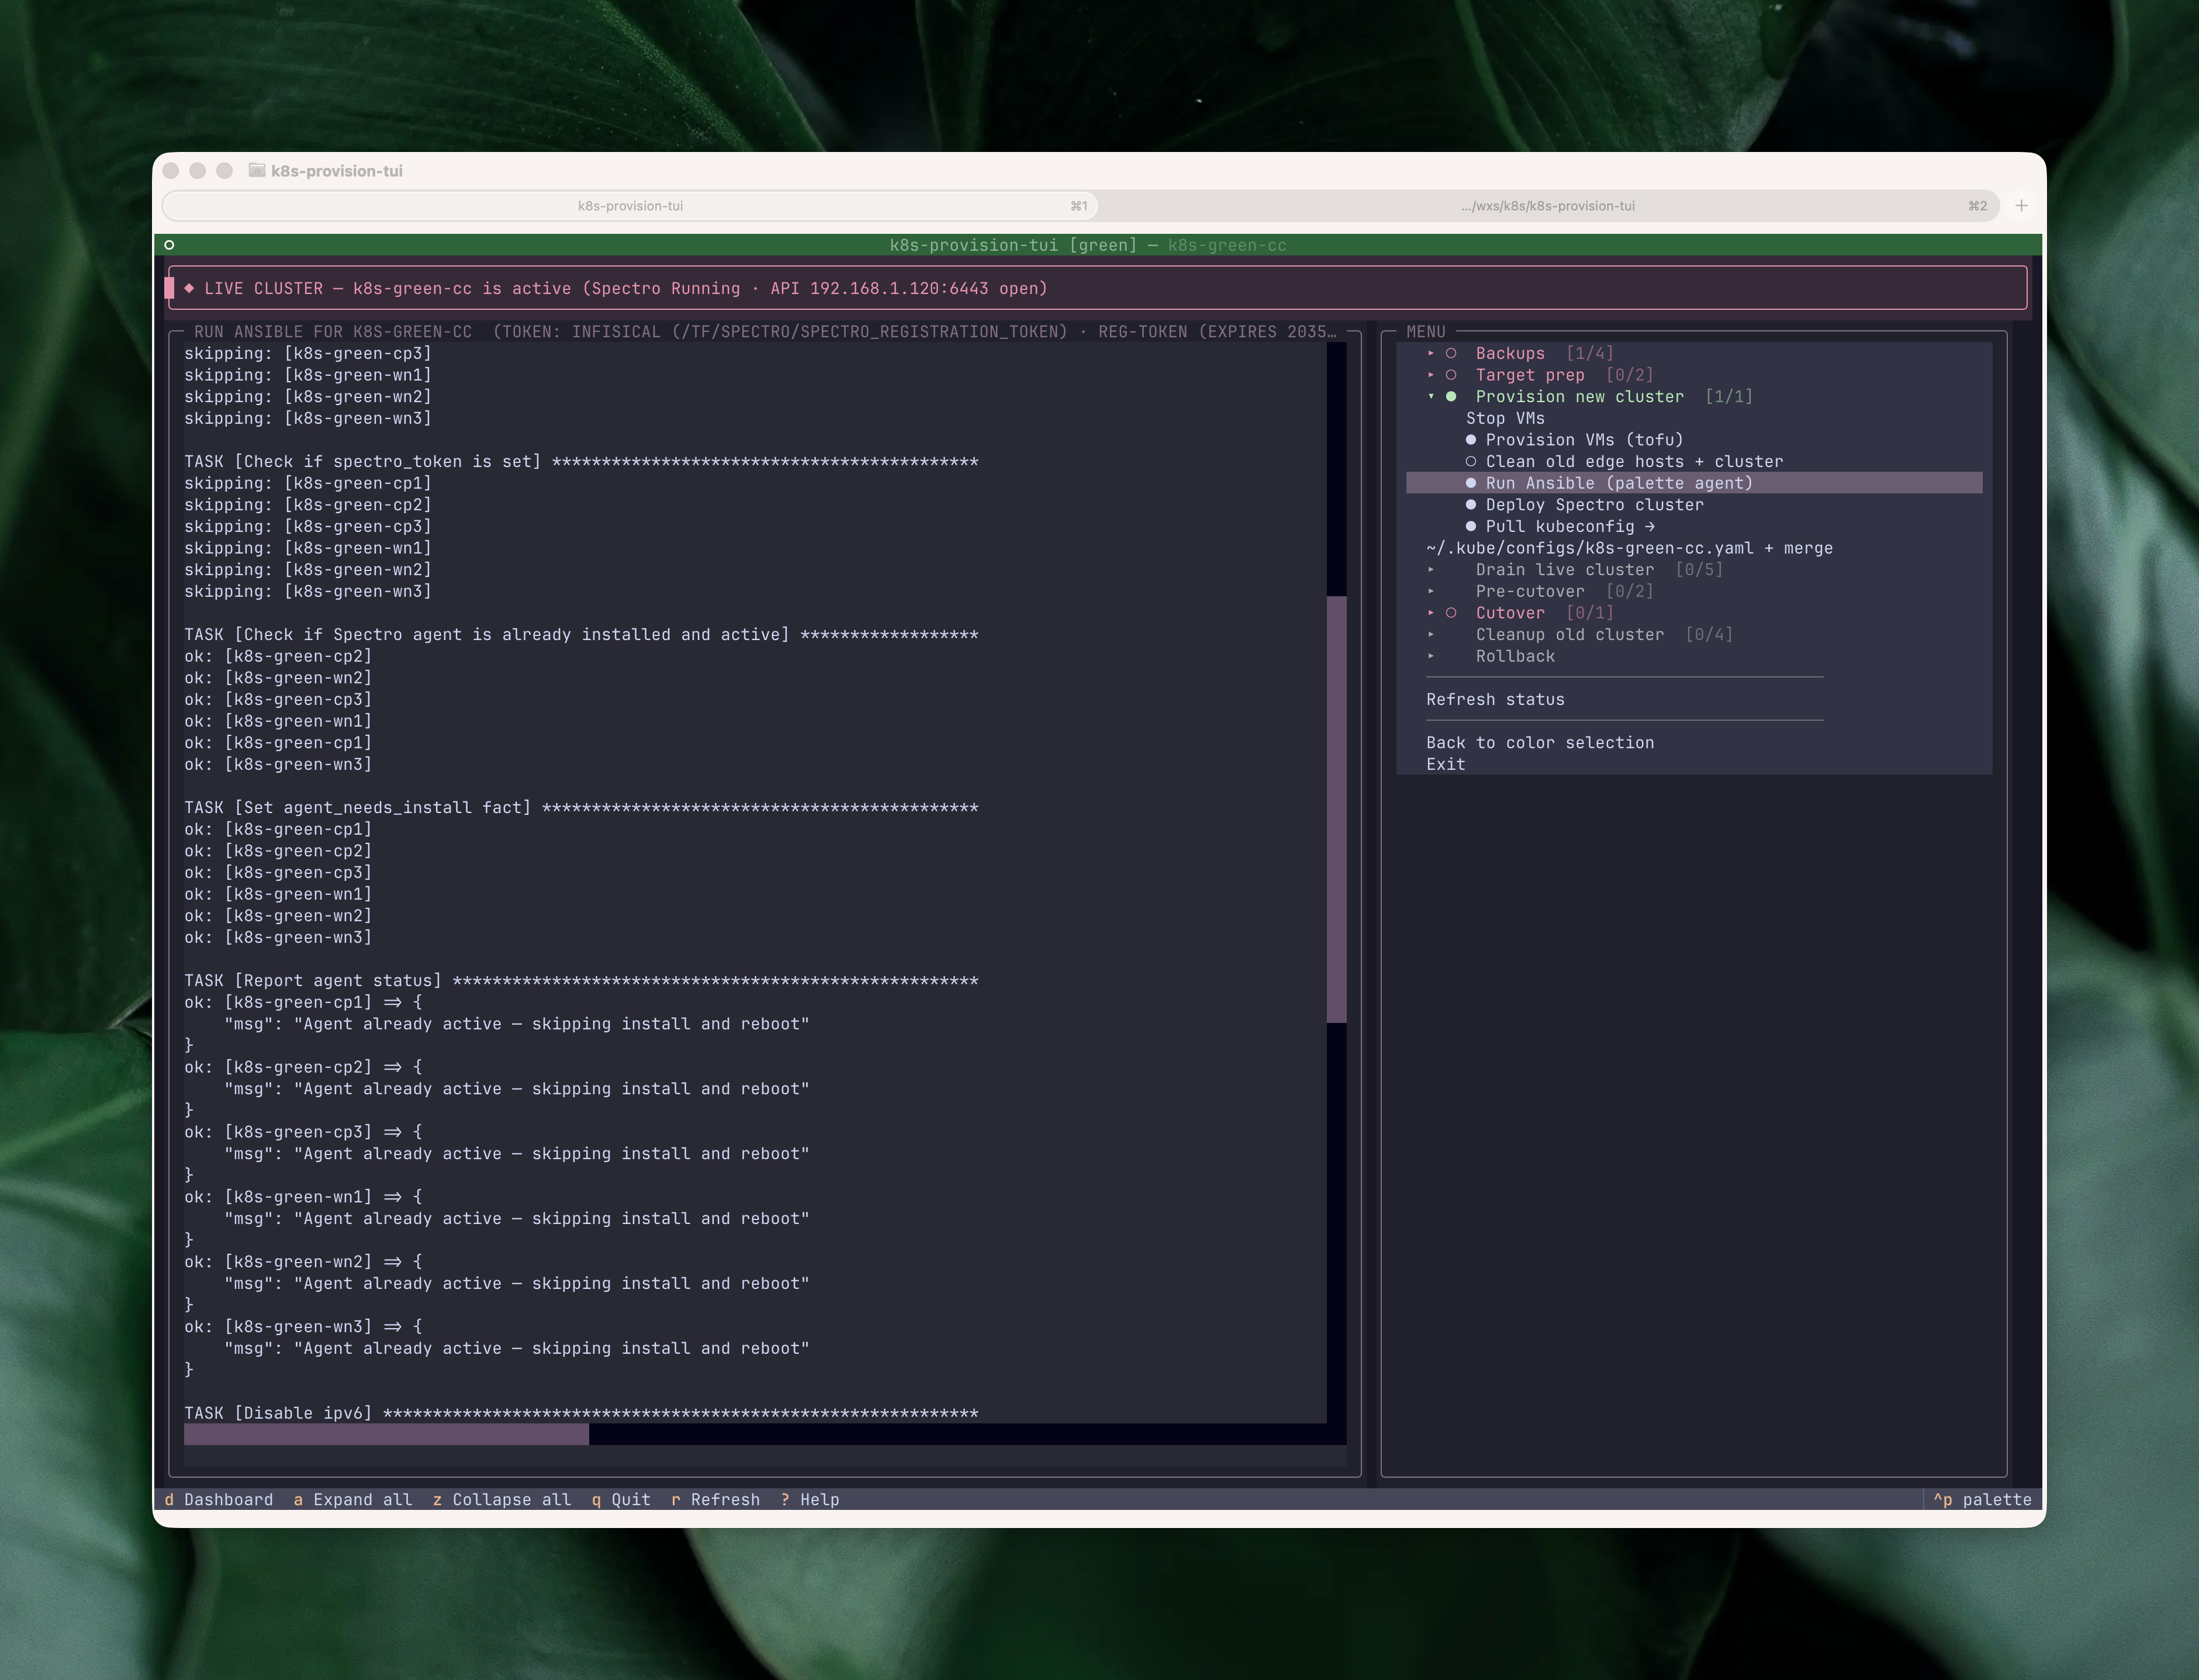
It’s a single-screen Textual app, split into three regions: a live status dashboard at the top, an accordion menu underneath, and a status bar at the bottom.
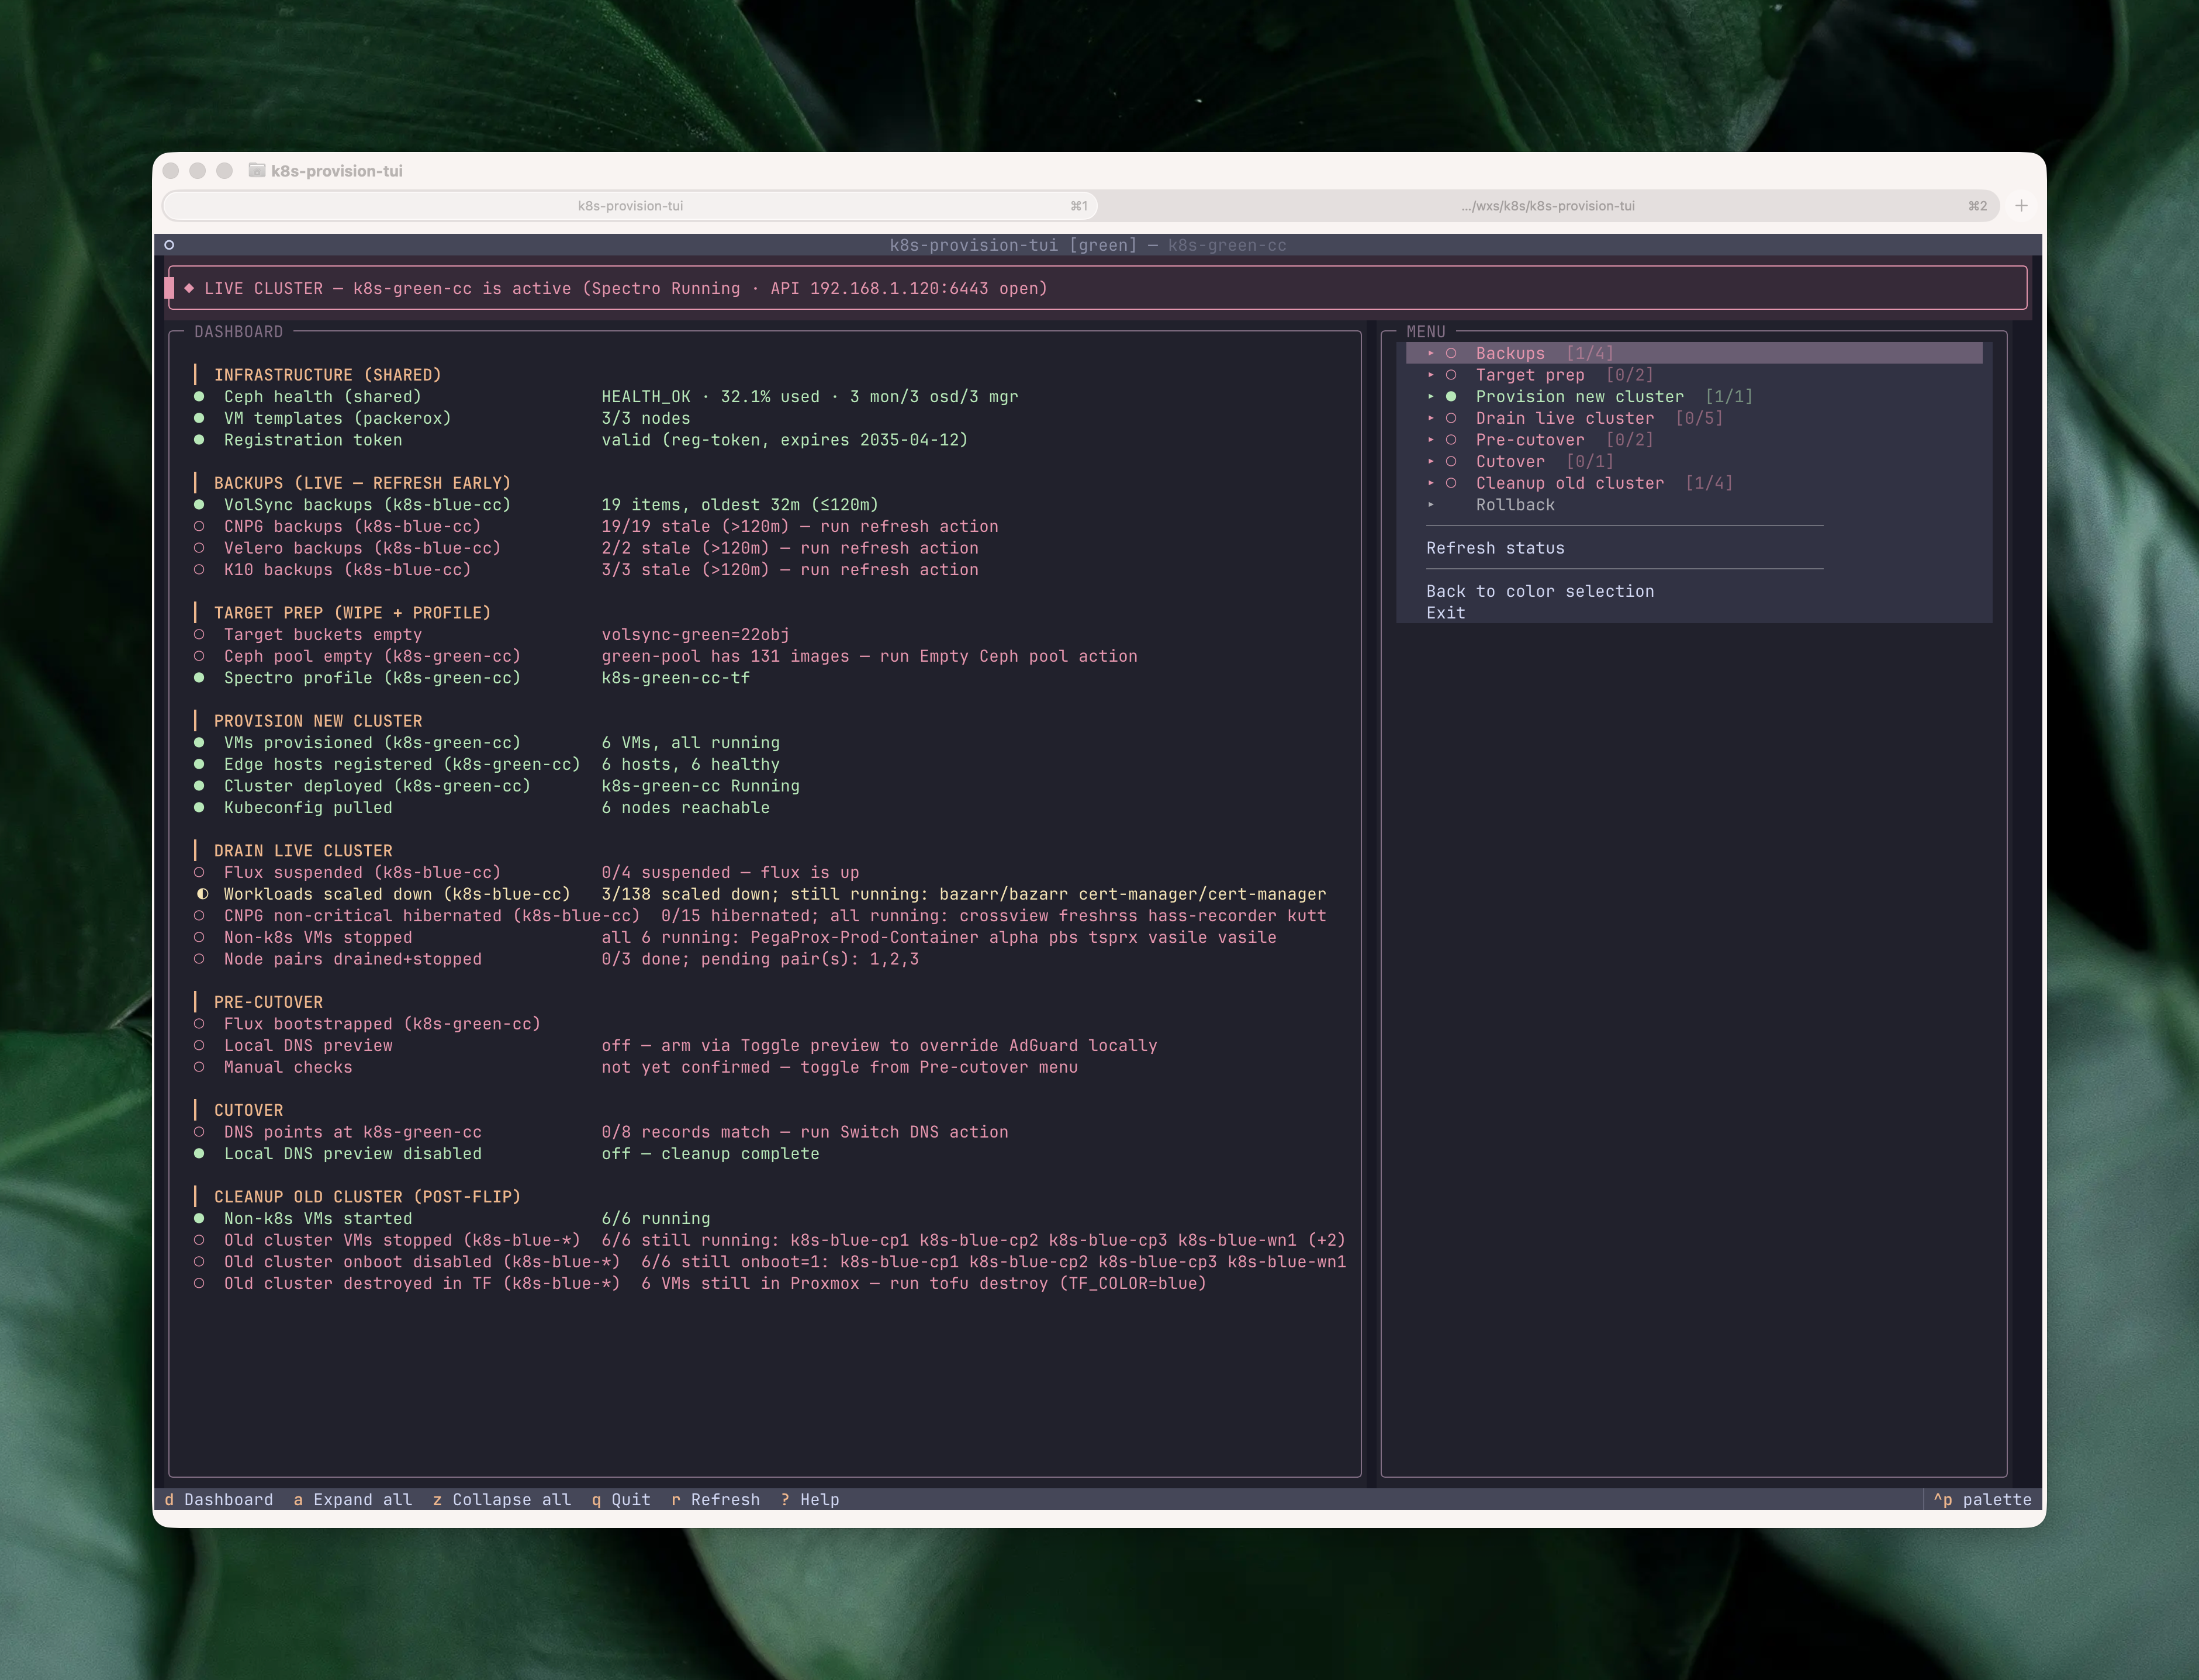
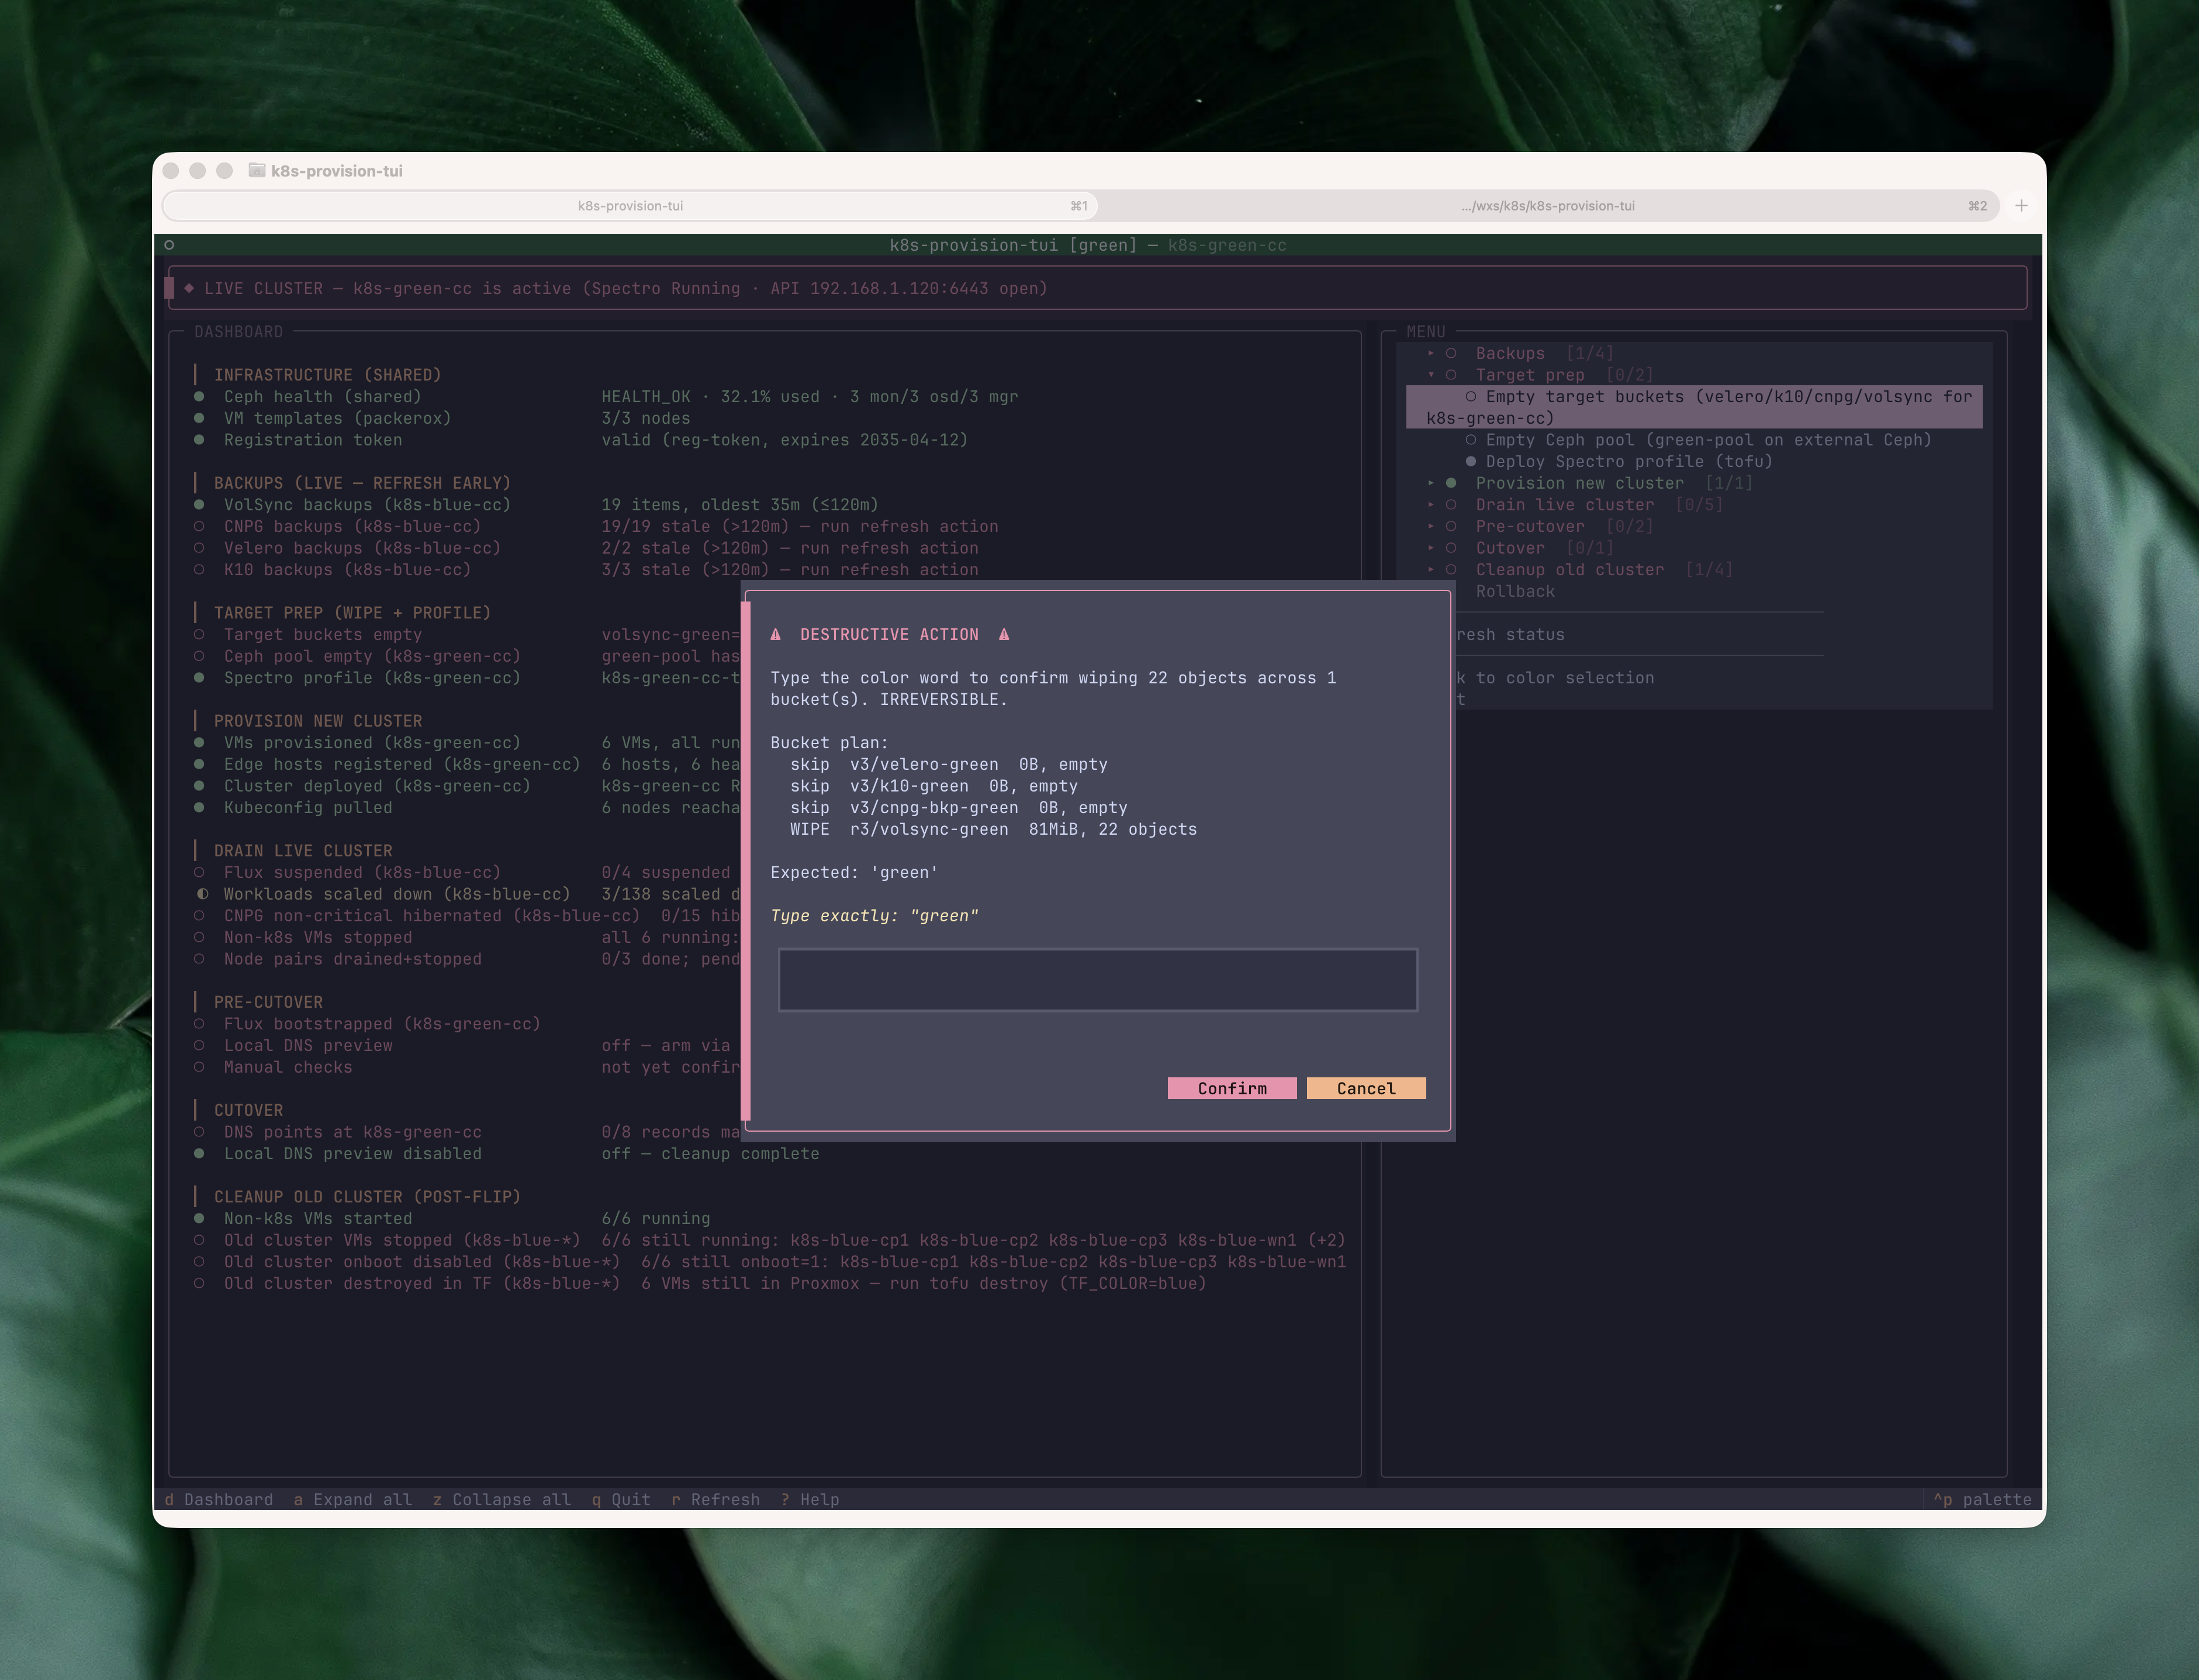
Each dashboard row is one check, grouped into the phases of a cutover: shared infrastructure (Ceph health, live Proxmox memory, VM templates, registration token), live-cluster backup freshness (VolSync, CNPG, K10, Velero, Forgejo dump), target prep (buckets empty, Ceph pool empty, Spectro profile deployed), provisioning (VMs, edge hosts, cluster, kubeconfig), draining the live cluster (Flux suspended, workloads scaled down, CNPG hibernated, non-k8s VMs stopped, node pairs drained, no stale cordoned nodes), pre-cutover sanity (Flux bootstrapped on target, pods ready, local DNS preview), the cutover itself (coordinated final-sync snapshot age, public DNS flipped, local DNS preview disabled, router port forwards repointed), a manual-checks gate, and post-flip cleanup of the old cluster (VMs stopped, onboot disabled, Terraform destroyed). The glyphs (●/◐/○) track state in real time. A threaded worker runs the checks on startup, after every action, and any time I press r; backup rows can also be put on a 5-second watch so freshness gates go green the moment a backup lands. The rows for the current phase of the cutover are where the operator’s eye naturally goes; the rest are a running check that the rest of the homelab isn’t on fire while I’m mid-cutover.
The menu mirrors the phases of the wiki runbook. Expanding a phase reveals its actions, each one annotated with its own status glyph based on the live dashboard state:
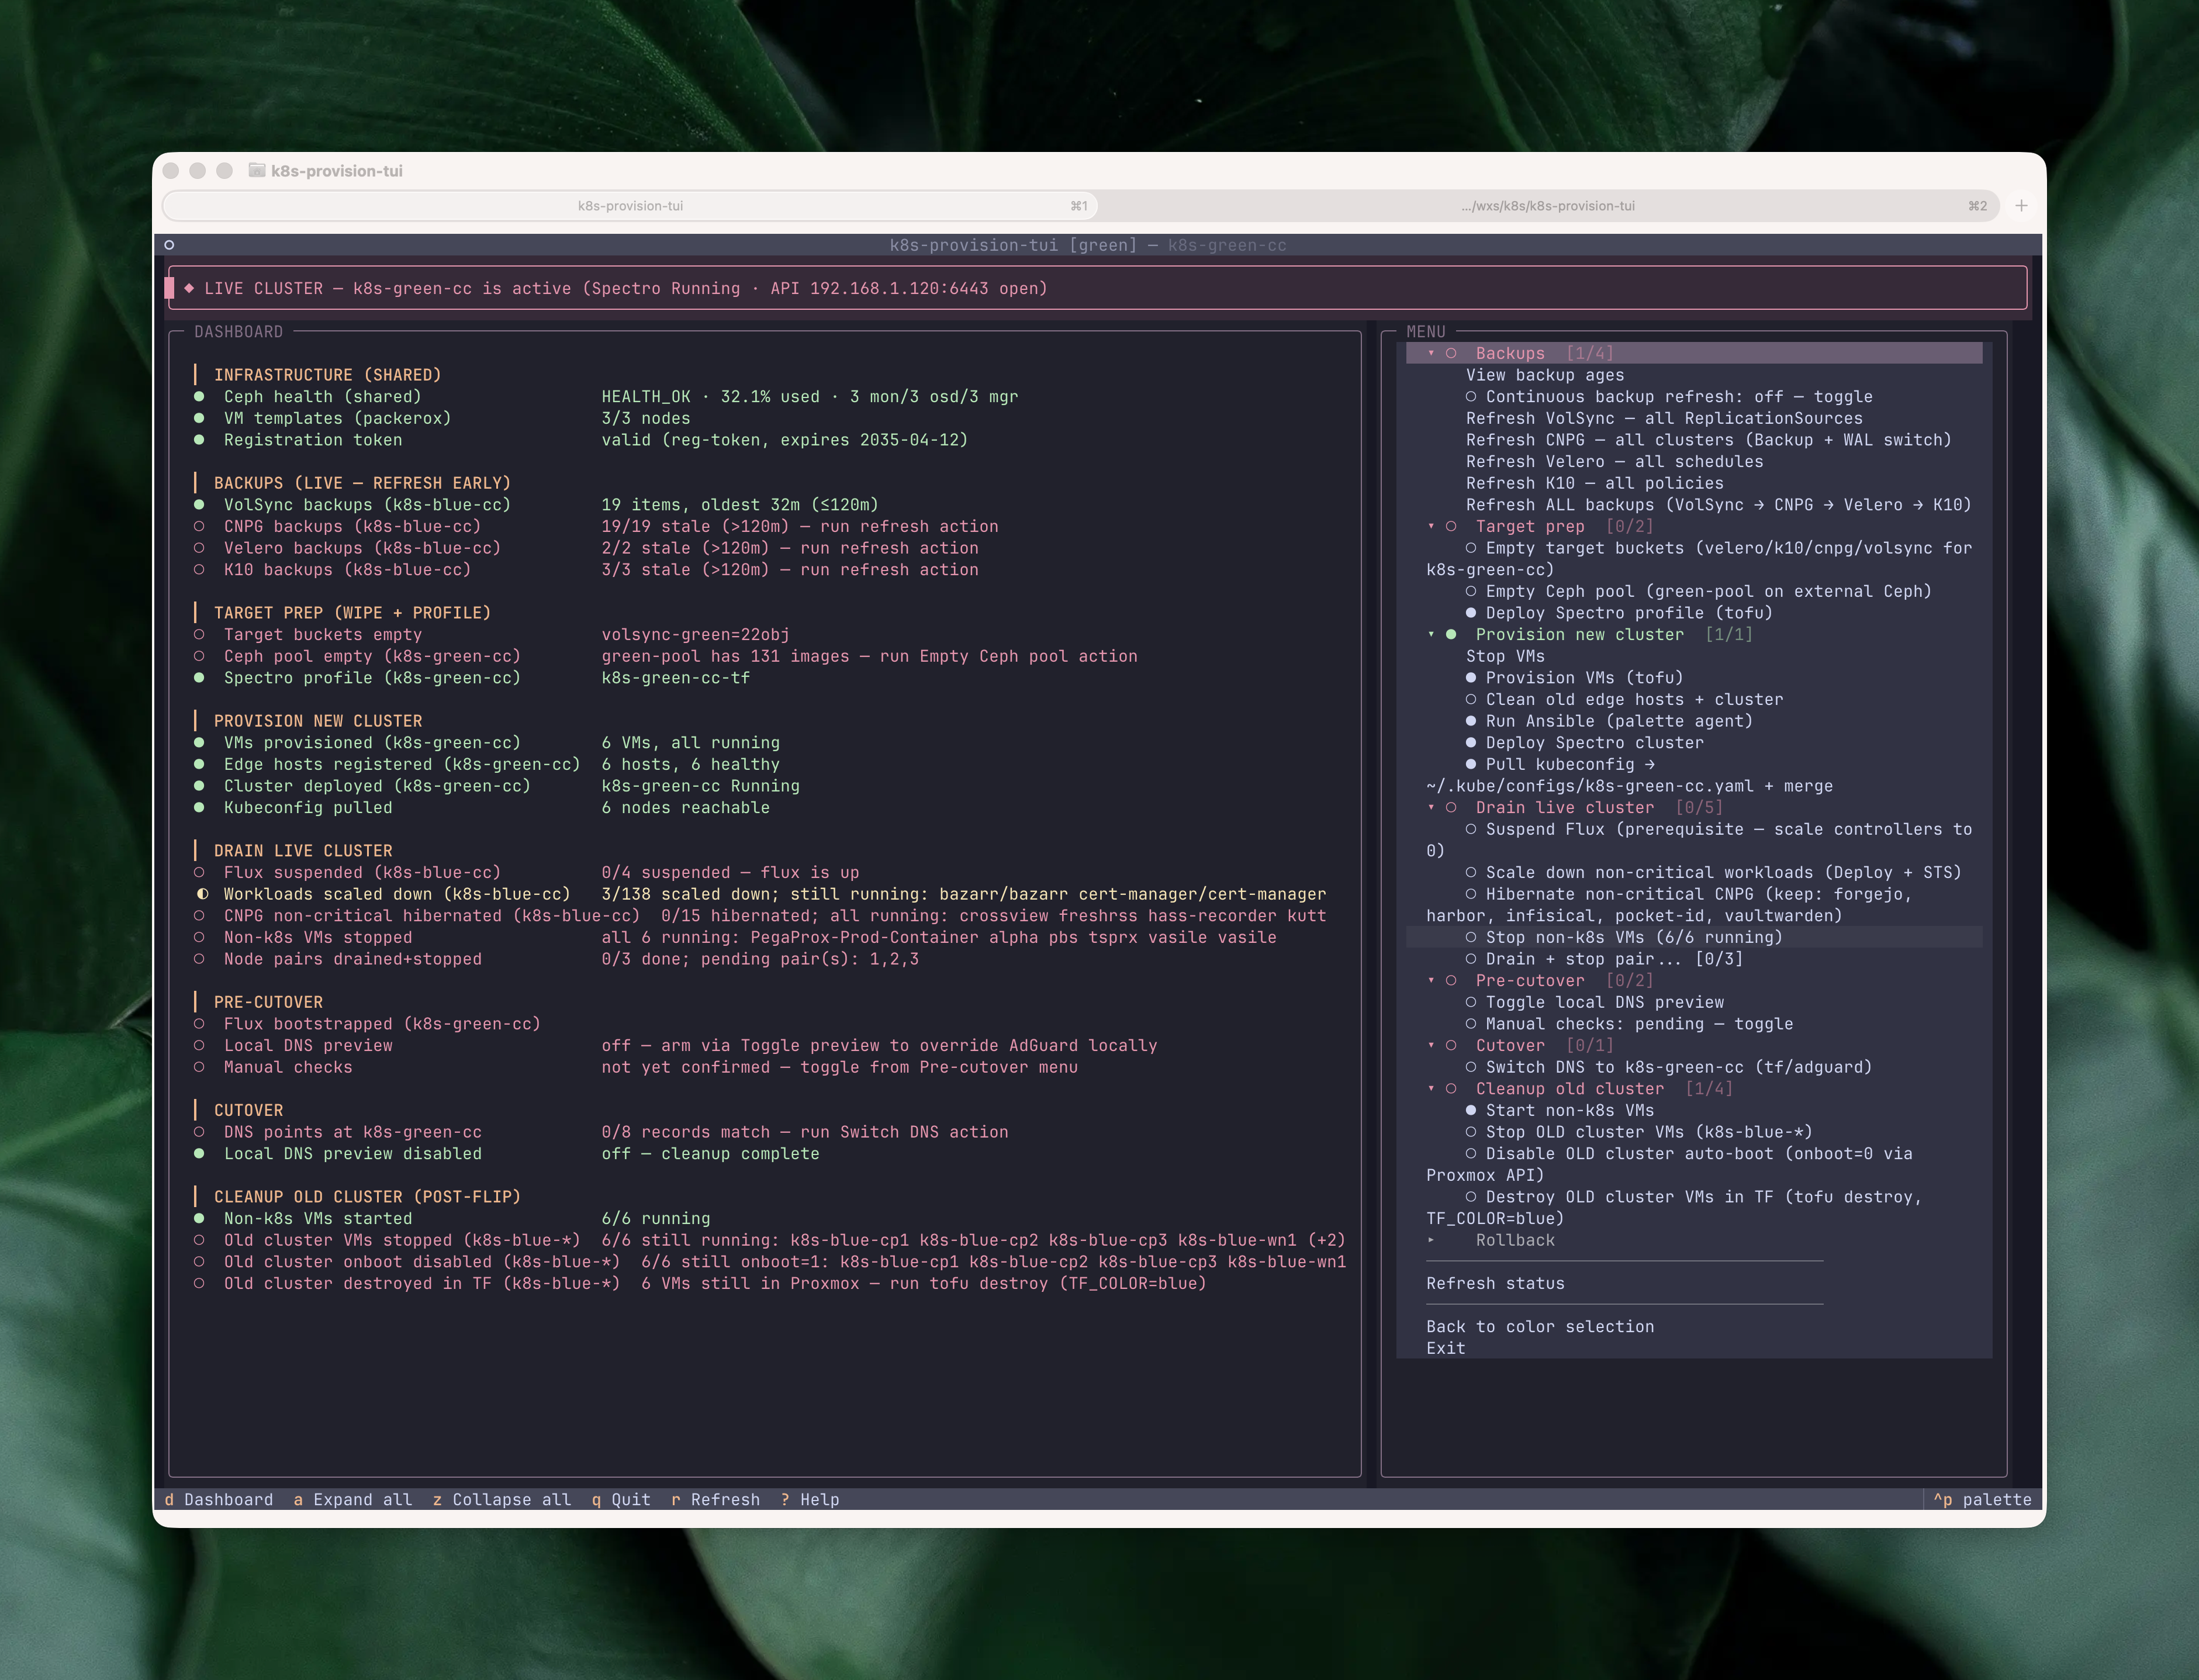
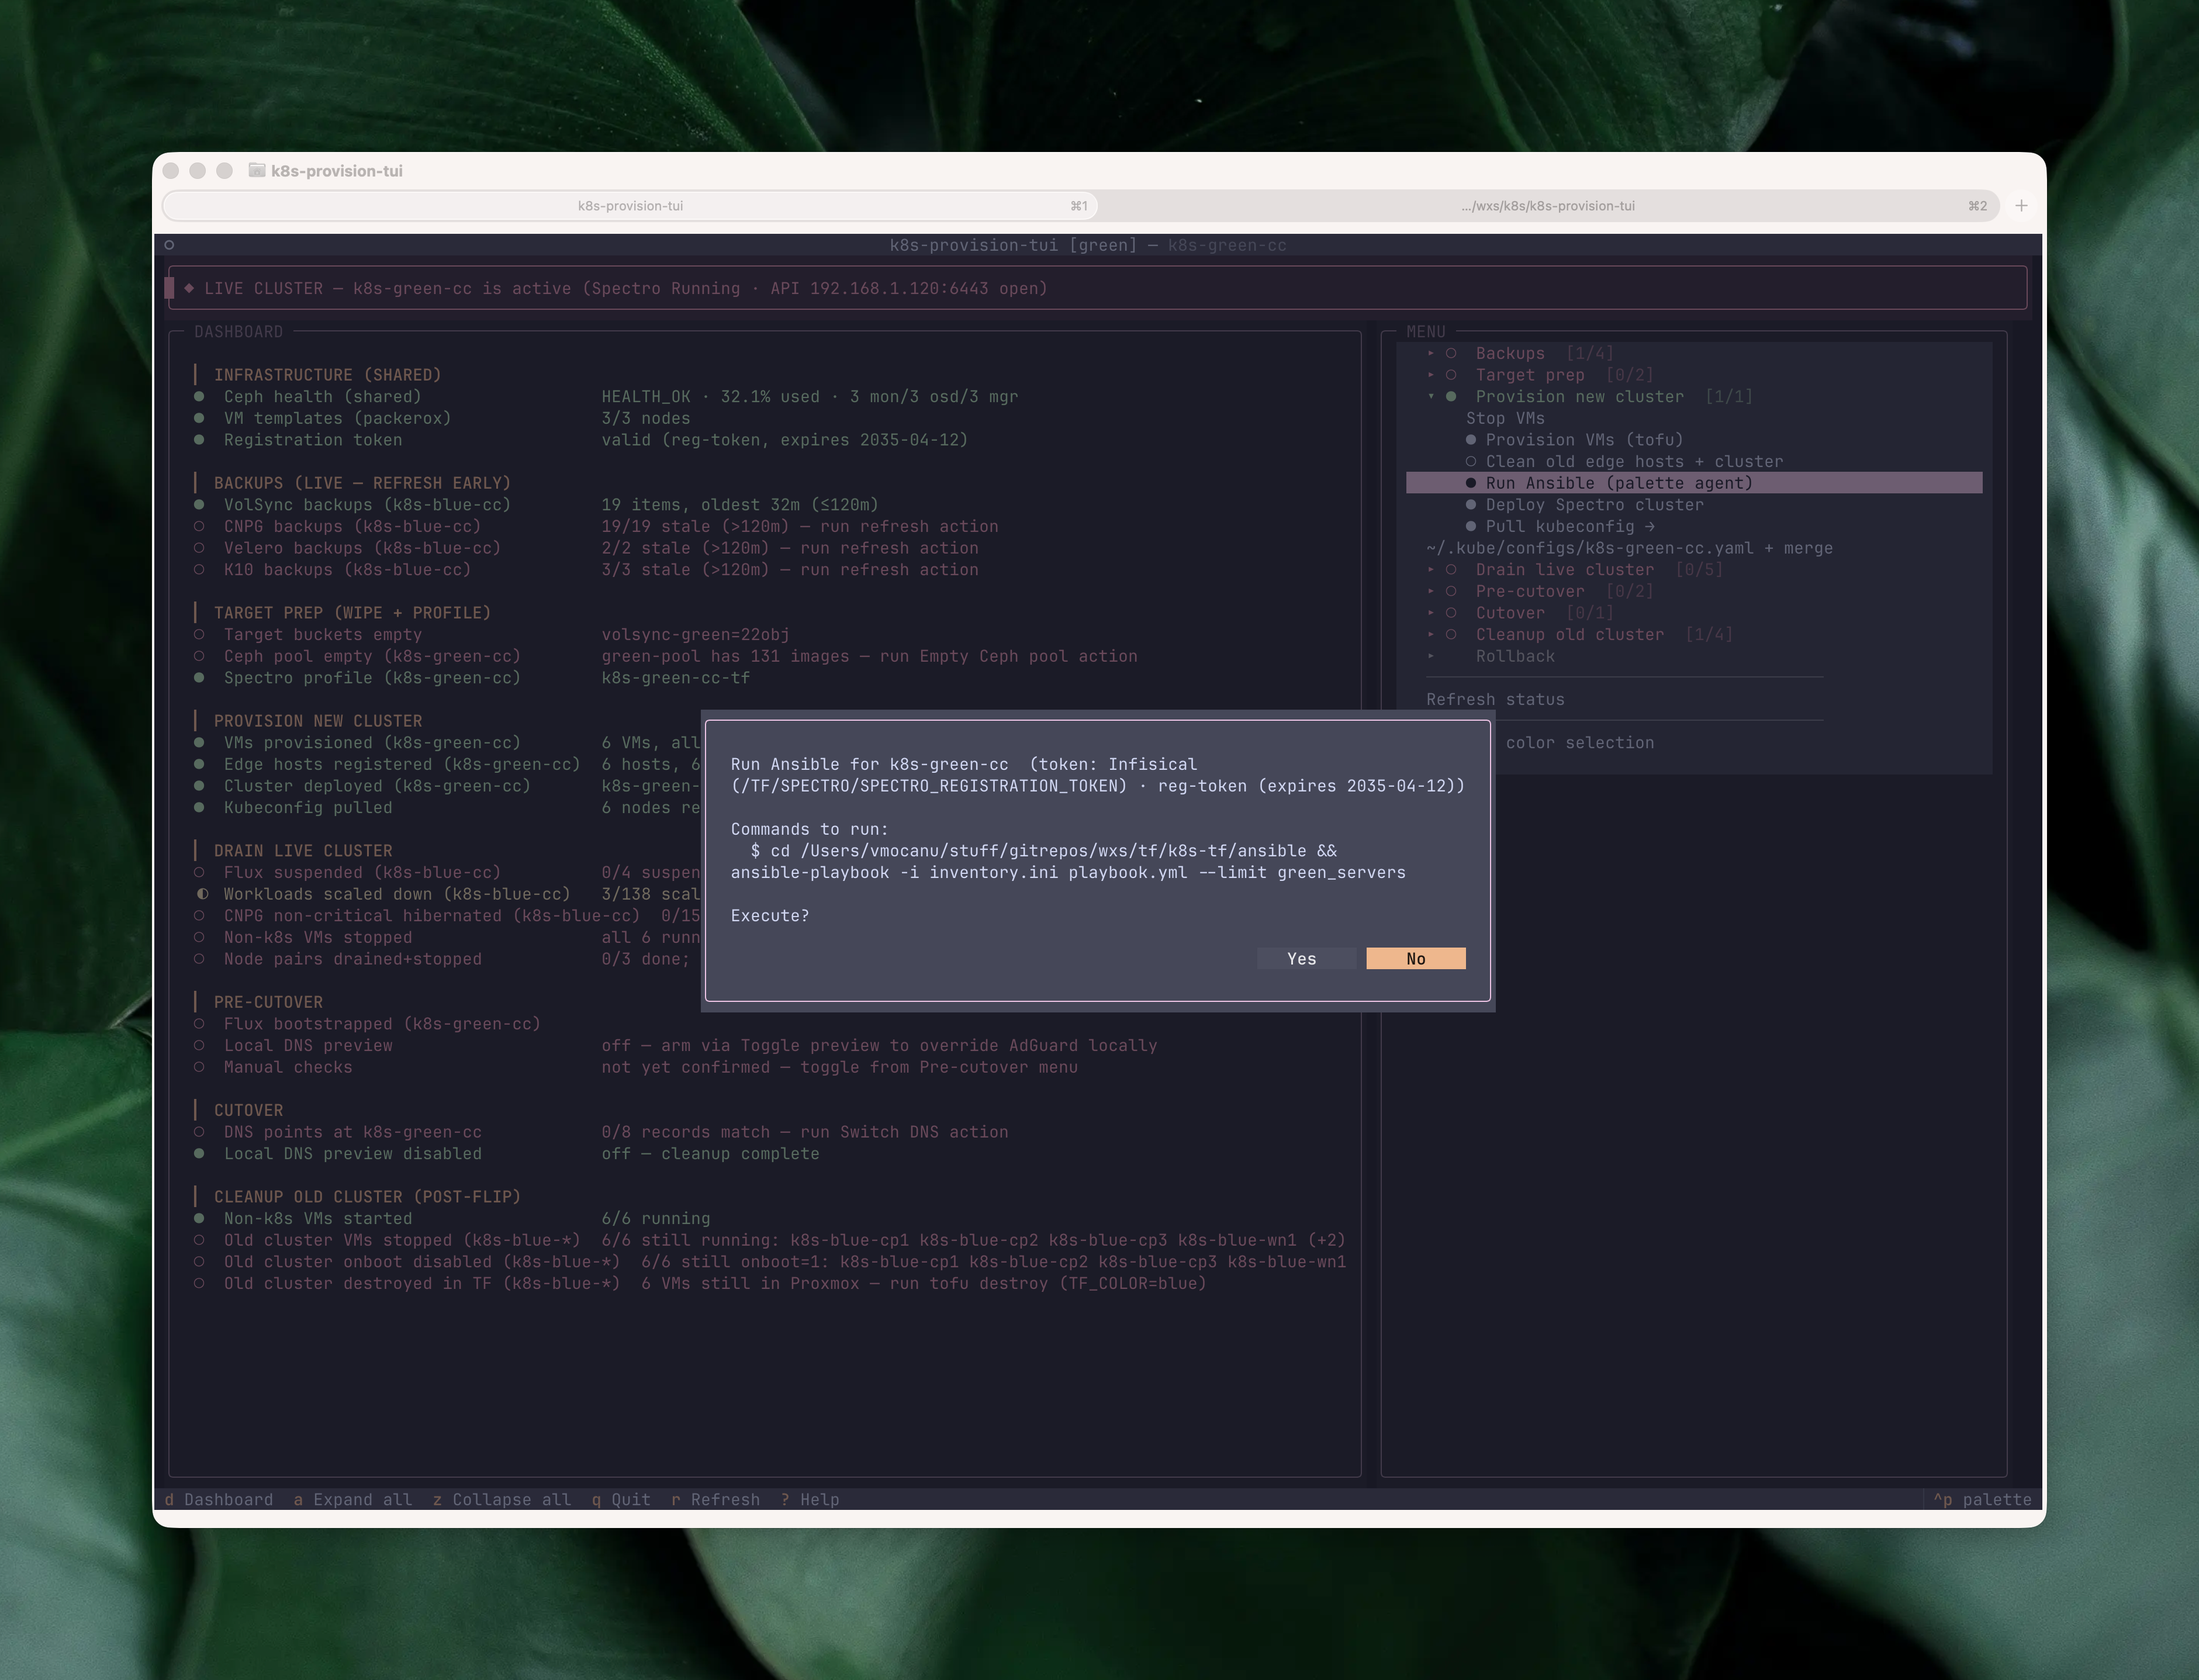
No action fires without a preview. Every action first shows a modal with the exact plan: which VMs, which clusters, which files, and the command chain that will run. For mutating actions the default button is “No”, so you have to deliberately say yes.
Once confirmed, output streams into a dashboard pane in place of the checklist. Instead of calling app.suspend() to hand the terminal over to the subprocess, the TUI stays on-screen and the subprocess output scrolls line by line into a log widget. A “Press Enter to return” modal closes the action when it finishes, and you never have to hunt through scrollback for a failed step. The whole destructive-action surface is pinned by a test suite that has grown past 280 cases covering type-to-confirm guards, liveness regressions, and pilot-driven screen navigation; the kind of coverage you want on a tool allowed to wipe backup buckets or reset Ceph pools.
The same streaming pattern covers API-driven actions too. The most destructive ones get an extra gate on top of the Yes/No: the bucket-wipe action runs mcli rm against four per-color backup buckets, so before it fires the confirm modal makes me type the color name (blue or green) literally. The same pattern guards the Ceph pool reset, where I have to type the pool name. Once past that, the pane shows each command, each per-bucket result, and a final summary modal:
The DNS flip isn’t the end. Once traffic is on the target color and the dashboard’s post-flip section lights up, the same TUI handles teardown: stopping the old cluster’s VMs, disabling their onboot so a Proxmox reboot doesn’t wake them up, and finally tofu destroy against the old color. The same pattern — preview, confirm, stream, dashboard row turns green — but pointed at deletion. Without the TUI, this is the part of the runbook I used to skip “until later” and end up with two clusters running for a week.
Where does this leave you?
If any of this resonates, do the thing. Open your DR plan (you have one, right? 😅), point the AI agent of your choice at it, and tell it to build a TUI for it. Start small. Iterate. The first version won’t be pretty; mine was hundreds of lines of bash and a nested gum menu. That’s fine. The payoff isn’t the TUI, it’s that every time you use it you’re rehearsing a restore you’d otherwise have done zero times.
My TUI started at ~4,000 lines of Python and has grown to ~16,000 as I keep folding in the next “thing I always forget at step 17”, intentionally specific to my homelab’s blue/green layout, and one of the most satisfying things I’ve built this year.